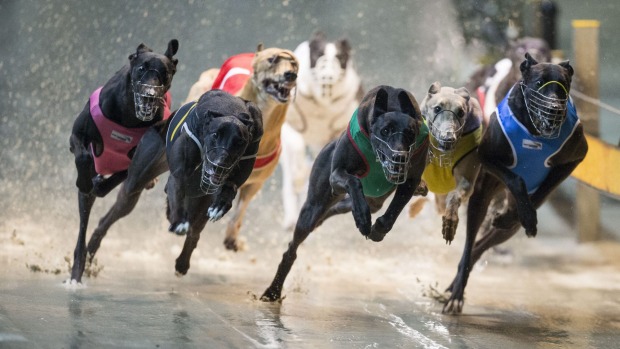
In yet another example of how the racing industry distorts the truth, Racing and Wagering WA (RWWA) has claimed an injury rate of 0.5% for 2018/19.
When the Coalition for the Protection of Greyhounds took issue with the formula used to determine these numbers, RWWA insisted that they were “fully transparent in respect to the reporting of greyhound injuries”.
In summary, RWWA arrives at its injury rate of 0.5% by counting every greyhound every time it runs and only including major injuries.
RWWA says that the reason injury rates are presented “as a percentage of total starters rather than by total number of greyhounds” is because a single greyhound may record more than one injury throughout the year. Their transparent reporting of greyhound injuries obviously doesn’t extend to stating whether each injured greyhound suffered one or multiple injuries.
1,391 greyhounds raced on WA tracks in 2018/19 and there were 736 injuries reported. As this represents an injury rate of approximately 40% it is easy to see why RWWA prefers their method of reporting.
This approach to minimising injury risk has been adopted almost universally by the greyhound industry in Australia and overseas.
CPG’s Jeff White provides figures below that represent the real injury risk to WA’s racing greyhounds.
Industry grossly underestimates the risk
With 25,750 race starts for 1,391 dogs, each dog raced an average of 18.5 times during the year. That means that the “per start” injury rate (0.5%) cited by the industry grossly underestimates the risk of injury over a year of racing for the average dog. The fact that some dogs sustain more than one injury during the year is not an argument that proves dog racing is any safer; it just means that some dogs are luckier than others! The point is that there are plenty of injuries to go around.
We can estimate the risk of serious injury to an average RWWA racing greyhound over the course of 2018/2019 as follows:
Major injuries
The industry says 0.5% of the 25,750 race starts resulted in a “major” injury. That’s 128 major injuries for a population of 1,391 dogs. That’s about a 9% chance of getting a major injury in one year, for one average racing greyhound! Even for consenting humans, that sort of risk would be unacceptable in any kind of athletic competition.

Even for consenting humans, a 9% chance of getting a major injury in one year would be unacceptable.
All injuries
Looking at injuries overall, 736 injuries for 25,750 starts means 2.86% of starts result in injury. Conversely, 97.14% (.9714) of racing starts result in no injury. Sounds pretty safe — if you’re only racing once a year.
But if you race 18.5 times a year, what are the chances you will NOT receive any injuries? Because each time you race, you face the same chance of injury. The answer is .9714 to the power of 18.5. i.e. .5846, or 58.46% probability of escaping injury over an entire year. Conversely, it means about 41.5% probability of sustaining one or more injuries during the year, for the average dog who races 18.5 times.
It’s not really about the stats and lack of industry transparency, it’s all about the risk.
The point about RISK of injury is that it describes not just what happened last year, but what is likely to happen now and in the future for the average dog that races in WA for a year. It’s subtle, but it’s the difference between arguing over history (in which the industry has all the stats and doesn’t share them all) and arguing over risk, as calculated using the industry’s own numbers, and using reasonable and conservative assumptions.
Sources:
https://www.yourlocalexaminer.com.au/industry-says-figures-quoted-by-group-are-not-accurate/
https://www.yourlocalexaminer.com.au/the-public-should-be-disgusted/
https://www.rwwa.com.au/wp-content/uploads/2019/11/Annual-report-2019_vFA_lowres_spread.pdf